What Is TAC in Cannabis? Total Active Cannabinoids Explained
Royal King Seeds
Cultivation team
The label says 28% THC — but that number is lying to you by omission. Most Australian cannabis consumers fixate on THC percentage while ignoring the metric that actually predicts the full experience: TAC, or Total Active Cannabinoids. Growers who understand TAC consistently report more nuanced, satisfying results than those chasing raw THC figures alone.
The threshold that separates a one-dimensional hit from a rich, full-spectrum effect is rarely THC at all — it's everything else in the plant working alongside it. This guide defines TAC precisely, explains how to read it on a certificate of analysis, and shows you which seed types and strain profiles deliver the highest TAC counts for Australian conditions.
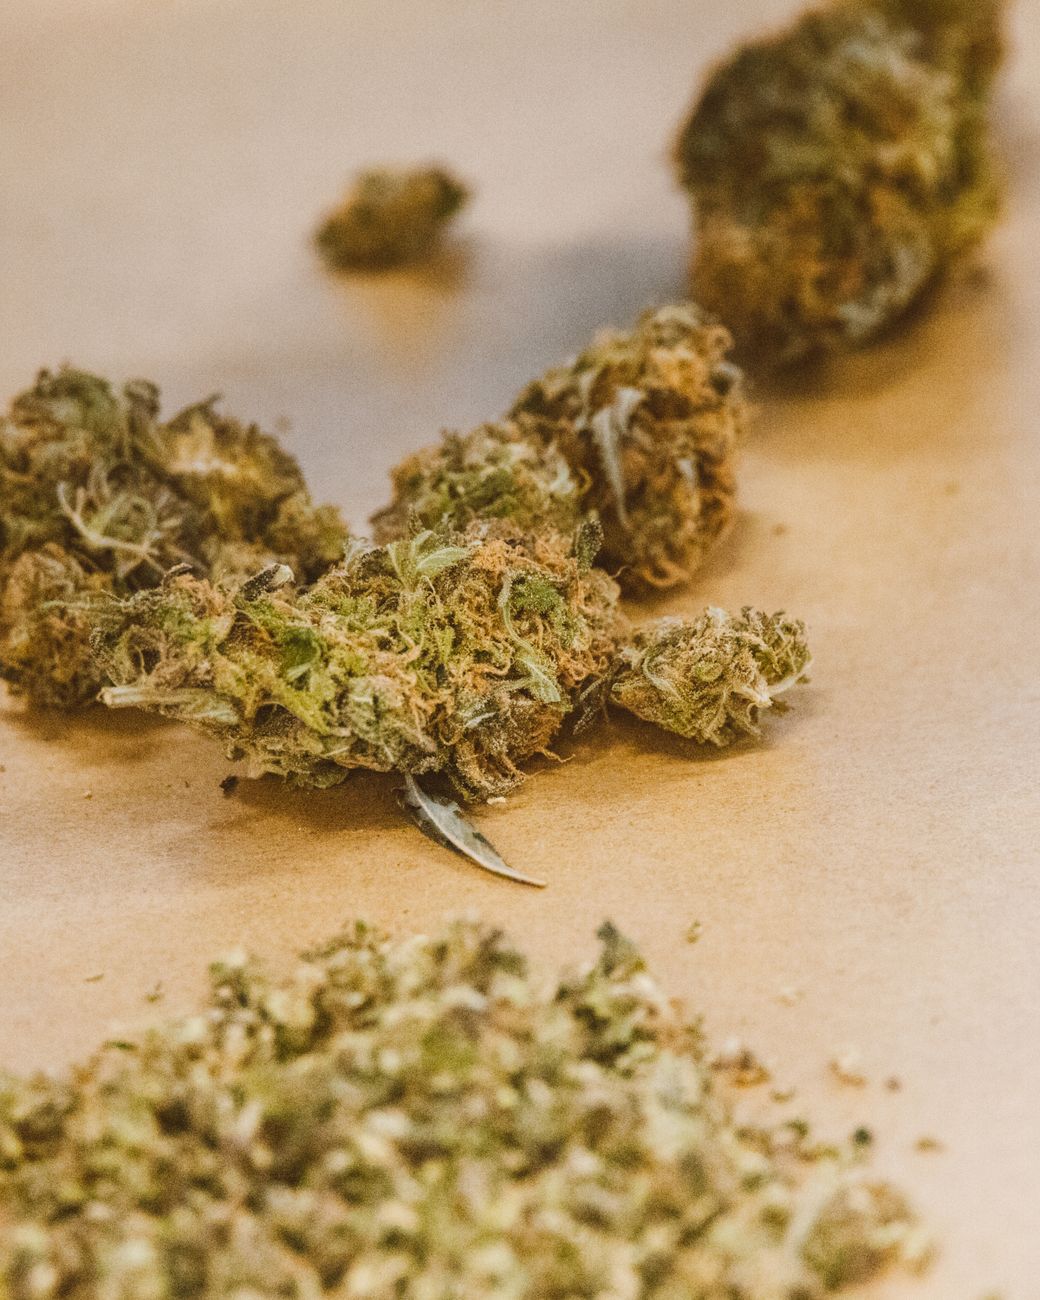
TAC stands for Total Active Cannabinoids — the combined percentage of every cannabinoid present in a cannabis sample, including THC, CBD, CBG, CBN, CBC, THCV, CBDV and others. A strain listing 22% THC and 31% TAC contains roughly 9% of other active cannabinoids beyond THC. These secondary cannabinoids amplify, modulate, or extend the effects of THC and CBD through a mechanism known as the entourage effect. TAC is considered a more complete potency indicator than THC percentage alone.
- ✓ Aussie growers selecting seeds for full-spectrum effects
- ✓ Consumers who want to read a lab Certificate of Analysis (CoA)
- ✓ Medical patients comparing CBD-to-THC ratios and minor cannabinoids
- ✓ Breeders and hobbyist growers (where cultivation is legally permitted)
- ✓ Anyone confused about the difference between THC%, CBD%, and TAC
- ✗ Readers seeking advice on illicit cultivation
- ✗ Those looking for medical prescriptions (consult a TGA-authorised prescriber)
- ✗ Readers expecting imperial measurements or USD pricing
What Is TAC in Cannabis?
TAC stands for Total Active Cannabinoids. It is the sum of all measurable cannabinoid percentages in a cannabis sample, expressed as a combined weight-by-volume percentage on a laboratory Certificate of Analysis (CoA).
Think of it as the "full roster" versus a single player's stats. A THC reading tells you how much tetrahydrocannabinol is in the flower. TAC tells you how much total cannabinoid chemistry is present across the entire molecular team — THC, CBD, CBG, CBN, CBC, THCV, CBDV, and dozens of minor compounds.
In practical terms: a strain with 22% THC and 31% TAC contains approximately 9% worth of additional active cannabinoids beyond THC alone. That 9% gap is where a lot of the nuance in effect comes from.
TAC is the most complete single-number potency indicator available on a standard CoA. If you're selecting seeds or flower for a specific effect profile — medical or recreational — always look at TAC alongside THC. A strain with 30%+ TAC from a diverse cannabinoid profile will generally outperform a 28% THC isolate-style cultivar in experiential richness. Seek out feminised cannabis seeds from breeders who publish third-party CoA data.
What Is the Difference Between TAC and THC?
THC (tetrahydrocannabinol) is a single cannabinoid — the primary psychoactive compound in cannabis. TAC is the umbrella metric that includes THC as one component.
The confusion arises because the cannabis retail market has historically marketed products on THC percentage alone. A dispensary shelf card showing "THC 26%" gives you one data point. The TAC reading on the same product might be 26.5% — meaning almost no minor cannabinoids are present — or it might be 34%, meaning an additional 8% of other cannabinoids contribute to the experience.
Those two products will feel very different, even at the same THC percentage. The ratio matters as much as the number.
| Metric | What It Measures | Includes Minor Cannabinoids? | Predicts Full Experience? | Common on Aussie CoA? |
|---|---|---|---|---|
| THC % | Single psychoactive compound | No | Partially | Yes (always) |
| CBD % | Single non-psychoactive compound | No | Partially | Yes (usually) |
| TAC % | Sum of ALL cannabinoids tested | Yes | Most accurately | Increasingly common |
| Terpene Profile | Aromatic/flavour compounds (not cannabinoids) | No | Complements TAC | Partial |
When comparing two cultivars, always compare TAC — not just THC. A strain with 24% THC and 33% TAC contains 9% worth of supporting cannabinoids that modulate and extend the THC experience. A 28% THC, 28.3% TAC cultivar is essentially a single-cannabinoid profile. For growers seeking specific effect profiles, that distinction is enormous. Browse high THC seeds Australia with full cannabinoid transparency where possible.
Which Cannabinoids Make Up the TAC Reading?
TAC is not a fixed formula — it depends on what the testing laboratory measures. Most accredited Australian cannabis labs test for the following cannabinoids when generating a TAC figure:
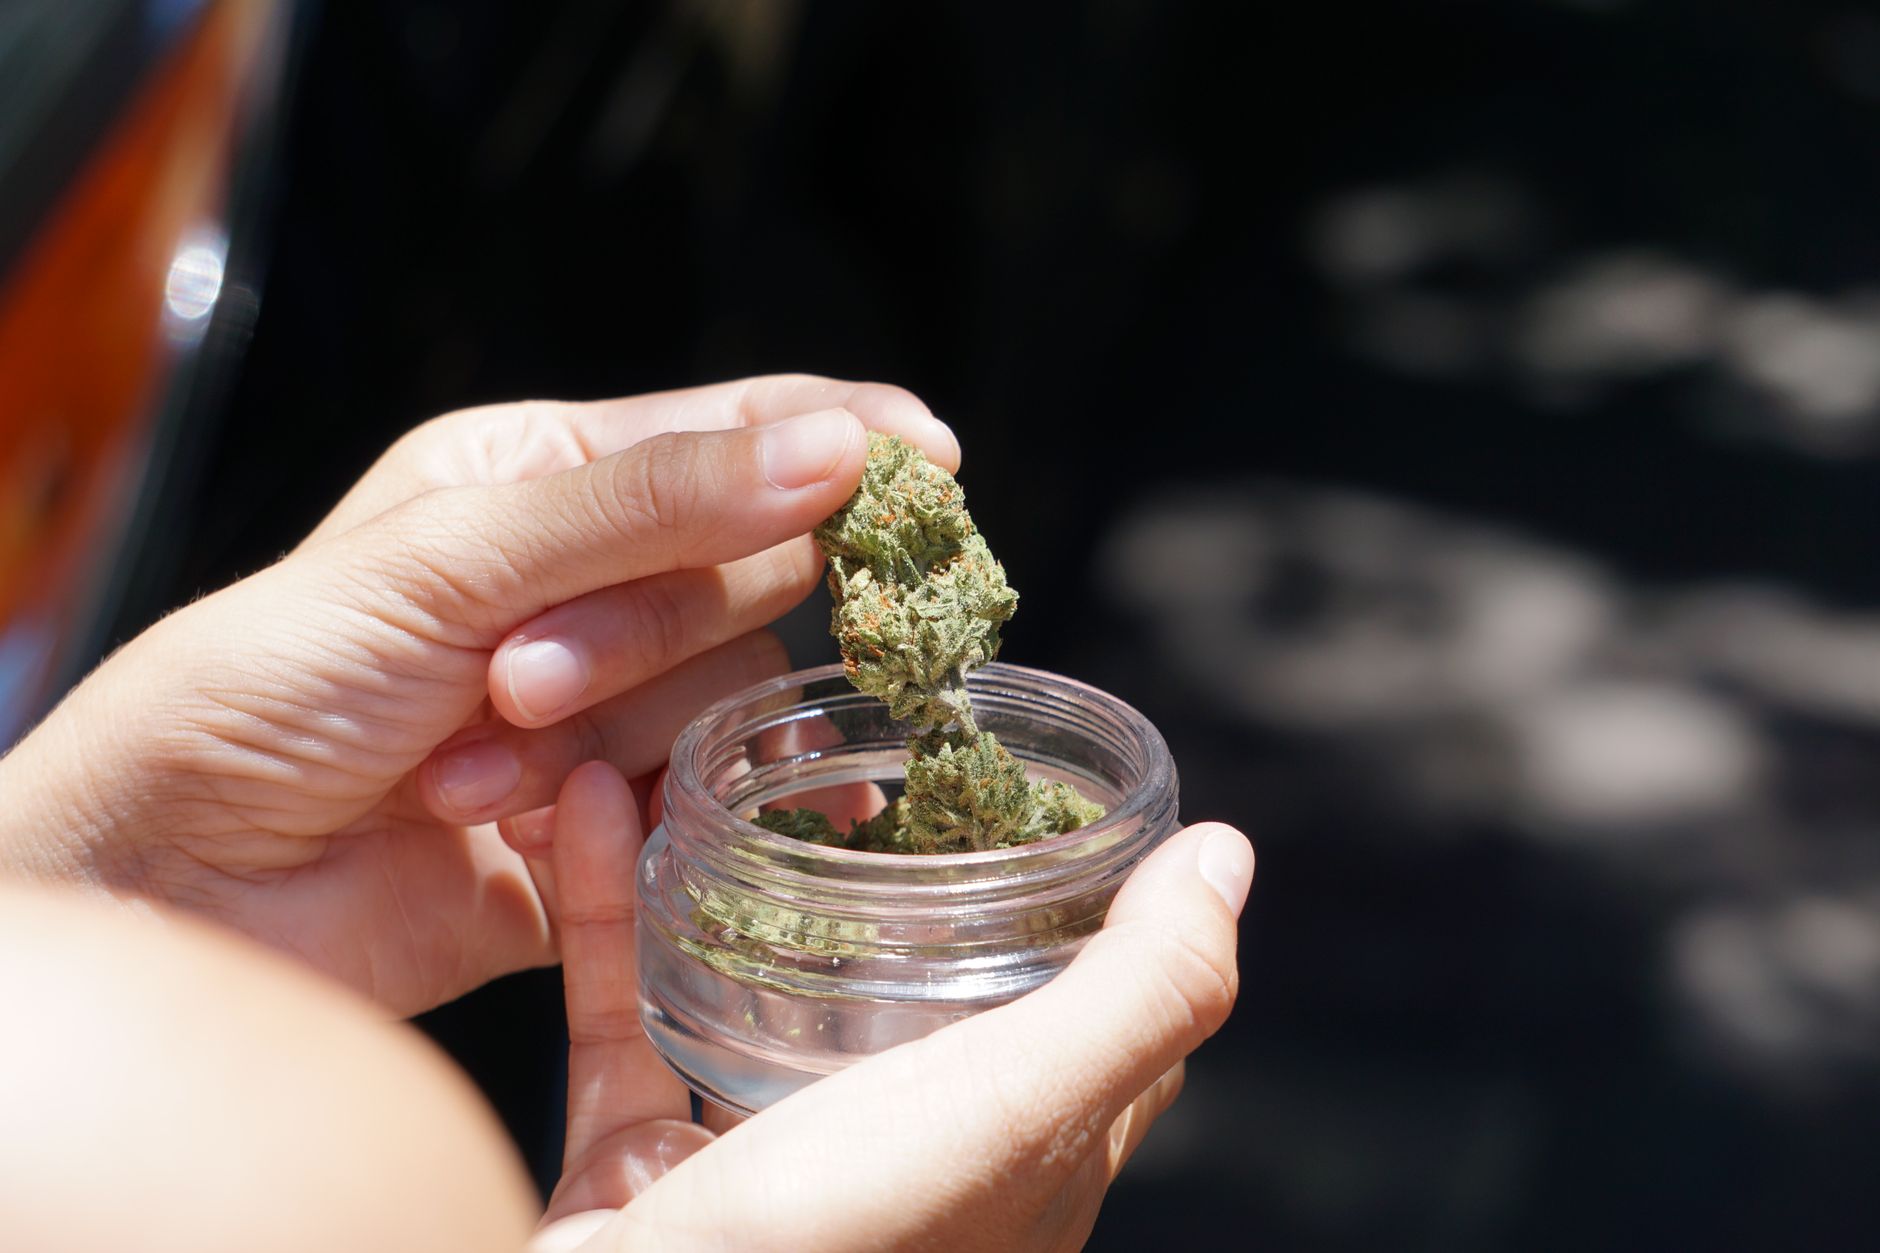
- THC (Δ9-Tetrahydrocannabinol) — Primary psychoactive; typically 15–30%+ in modern cultivars
- THCA (Tetrahydrocannabinolic acid) — Non-psychoactive precursor; converts to THC when heated
- CBD (Cannabidiol) — Non-psychoactive; modulates anxiety and inflammation
- CBDA (Cannabidiolic acid) — Raw precursor to CBD
- CBG (Cannabigerol) — "Mother cannabinoid"; antibacterial and focus-associated properties
- CBN (Cannabinol) — THC degradation product; associated with sedation
- CBC (Cannabichromene) — Anti-inflammatory synergist
- THCV (Tetrahydrocannabivarin) — Fast-acting, shorter duration; appetite-suppressing at low doses
- CBDV (Cannabidivarin) — Non-psychoactive; researched for neurological applications
- CBGA (Cannabigerolic acid) — Biosynthetic precursor to all other cannabinoids
Some labs include additional minor cannabinoids such as THCP, CBGV, and CBL. The broader the test panel, the more complete the TAC figure — which is why two labs can return different TAC numbers for the same sample.
According to research indexed on PubMed, over 100 distinct phytocannabinoids have been identified in the cannabis plant, though most appear in trace quantities below 0.1%.
When evaluating a TAC figure, always check which cannabinoids the lab actually tested. A panel of 5 cannabinoids will produce a lower TAC than a panel of 15 — even for the same flower. Ask for the full panel breakdown, not just the headline TAC number. Reputable Australian seed banks and medicinal producers increasingly publish extended 10–15 cannabinoid CoA panels.
How Does TAC Connect to the Entourage Effect?
The entourage effect is the widely-cited phenomenon where cannabinoids, terpenes, and other phytochemicals in cannabis work synergistically — producing effects that no single compound achieves alone.
TAC is essentially a proxy measure for entourage effect potential. A higher TAC — especially one driven by a diverse cannabinoid spread rather than a single dominant compound — predicts greater synergistic complexity.
A landmark concept in cannabis pharmacology, the entourage effect was described in foundational research by Dr Raphael Mechoulam and colleagues. A 2020 paper in the Journal of Cannabis Research confirmed that whole-plant extracts consistently outperformed isolated cannabinoids in clinical effect depth and duration — supporting the case for TAC as a meaningful metric.
A high TAC driven by multiple cannabinoids delivers more entourage effect than a high TAC driven almost entirely by one compound.
Formula: TAC Diversity Score = (Number of cannabinoids ≥0.3%) ÷ TAC% × 100
Worked Example: Strain A has 31% TAC with 7 cannabinoids above 0.3% → Score: 7 ÷ 31 × 100 = 22.6 (diverse profile). Strain B has 30% TAC with 2 cannabinoids above 0.3% → Score: 2 ÷ 30 × 100 = 6.7 (narrow profile). Strain A wins on entourage effect potential even though its TAC is barely higher.
Use the TAC Diversity Rule to compare two cultivars with similar TAC totals. The one with a broader cannabinoid spread will almost always deliver a richer effect. For Australian medical patients, this is especially relevant when evaluating CBD cannabis strains where the CBD-to-THC ratio and supporting minor cannabinoids carry significant therapeutic weight.
How Do You Read TAC on a Cannabis Lab Report?
Step 1: Locate the Certificate of Analysis (CoA)
A CoA is a third-party laboratory document listing the measured cannabinoid concentrations in a cannabis sample. In Australia, licensed medicinal cannabis producers must publish CoA data under TGA regulations. For seed selection, look for breeders who share parent-plant CoA data.
Step 2: Find the cannabinoid panel section
The CoA will list each tested cannabinoid in columns. You'll typically see: compound name | % dry weight | mg/g. Scan down the list to identify which cannabinoids are measurable (above the lab's limit of detection, typically 0.01–0.05%).
Step 3: Identify the TAC line
Many modern CoAs include a "Total Active Cannabinoids" or "TAC" summary line at the bottom of the cannabinoid table. If it's absent, calculate it yourself: add together all individual cannabinoid percentages listed on the report.
Step 4: Calculate TAC if absent from the report
Formula: TAC = THCA% + THC% + CBDA% + CBD% + CBG% + CBN% + CBC% + [any other listed cannabinoid%]. This is basic addition. A result of 28–35% is strong. Below 20% suggests either a low-potency cultivar or a limited test panel.
Step 5: Assess the diversity of your TAC
Count how many individual cannabinoids appear above 0.3% on the report. Apply the TAC Diversity Rule from above. A strain with TAC of 30% and 8 contributing cannabinoids is a fundamentally different product to one with 30% TAC and only THC+THCA above meaningful thresholds.
Reading a CoA takes less than 60 seconds once you know the pattern. Make it non-negotiable before purchasing any cannabis product in Australia — medicinal or otherwise. Reputable seed banks will share parent-plant CoA data, giving you confidence in the genetics you're growing (where legally permitted).
What Seed Types Tend to Produce the Highest TAC?
Looking at publicly available breeder data, grower forum reports, and published strain specifications, certain seed categories and genetic profiles consistently produce broader, higher TAC readings. Here's what the pattern shows across the data:
| Seed Type / Category | Typical THC Range | Typical TAC Range | Minor Cannabinoid Depth | Mould Resistance | Beginner Rating | RKS TAC Value Score |
|---|---|---|---|---|---|---|
| Full-Spectrum Feminised (Indica-dom) | 20–28% | 27–35% | High | Medium | 6/10 | 88/100 |
| High-THC Sativa Feminised | 22–30% | 24–32% | Medium | Low–Med | 5/10 | 79/100 |
| CBD-Rich Balanced (1:1 ratio) | 8–14% | 18–28% | Very High | High | 8/10 | 85/100 |
| Autoflower (Standard) | 16–22% | 18–26% | Low–Med | High | 9/10 | 71/100 |
| High-THC Autoflower (Modern) | 20–27% | 23–30% | Medium | High | 8/10 | 81/100 |
RKS TAC Value Score methodology: cannabinoid depth 40% + TAC ceiling 30% + beginner suitability 20% + mould resistance 10%. Scores reflect aggregated breeder-published specifications and public grower report data.
Why the Top 3 Ranked This Way
Why Full-Spectrum Feminised Indica scored #1 (88/100):
- Consistently produces the broadest minor cannabinoid spread (CBG, CBC, CBN all commonly above 0.3%)
- TAC ceiling reaches 35%+ in elite genetics like Afghan and Hindu Kush-derived lines
- Shorter flowering period means less cannabinoid degradation from prolonged heat exposure in Aussie summers
Why CBD-Rich Balanced (1:1) scored #2 (85/100):
- CBD itself is a major cannabinoid contributing 8–14% to TAC, plus it brings CBDA and supporting minors
- Very high mould resistance suits humid QLD and coastal NSW climates
- Ranked lower on TAC ceiling (raw % stays below 28% typically) vs indica-dominant genetics
Why standard Autoflowers ranked #4 (71/100):
- Ruderalis heritage typically reduces minor cannabinoid depth
- Shorter cycle = less time to accumulate secondary cannabinoid biosynthesis
- Excellent for beginners and short seasons, but TAC diversity lags behind photoperiod genetics
For maximum TAC diversity, full-spectrum indica seeds from stable genetics remain the benchmark. For growers who need speed and beginner-friendliness without sacrificing too much cannabinoid complexity, modern high-THC autoflower seeds are a strong middle-ground choice. Always cross-reference with published CoA data where available.
How Does TAC Relate to Australian Growing Conditions by State?
TAC is a genetics-driven metric, but environmental conditions during the grow significantly affect final cannabinoid expression. High heat, excessive UV, humidity stress, and improper harvest timing can all suppress minor cannabinoid development. Here's how Aussie climate zones interact with TAC outcomes (for growers in jurisdictions where cultivation is legally permitted).
NSW — Temperate Coast and Inland Heat
Sydney's temperate coast allows long growing windows (Oct–Apr), giving genetics time to develop full cannabinoid profiles. Inland NSW growers face 38–42°C+ summer heat that can degrade THCA and suppress CBG accumulation. Harvest timing in March captures peak minor cannabinoid expression before autumn humidity arrives.
VIC — Cool Temperate, Short Window
Melbourne's unpredictable shoulder seasons — warm days, cold nights from April onward — compress the effective growing window. Strains with TAC that peaks early (fast-finishing feminised indica or high-THC auto genetics) suit VIC better than long-season sativa genetics that need more time for full cannabinoid development.
QLD — Subtropical Humidity Challenge
South-east QLD's high humidity from January through March creates mould risk that can devastate cannabinoid profiles if buds are lost to Botrytis. Selecting genetics with high mould resistance — particularly CBD-rich cultivars with dense trichome protection — preserves TAC through to harvest. Far North QLD's tropical conditions suit fast-cycling strains only.
WA — Mediterranean, Ideal Conditions
Perth's dry Mediterranean climate (hot summers, mild winters, very low humidity) is arguably Australia's best environment for maximising TAC. Low humidity through flowering allows trichome development without mould interference. Long dry autumns give late-season genetics the time they need for full cannabinoid expression. Growers here report consistently higher cannabinoid readings on CoAs versus equivalent grows in humid eastern states.
SA — Dry Heat, Quality Over Quantity
Adelaide's Mediterranean climate shares WA's advantages. Extreme summer heat (40°C+ days inland) can stress plants if irrigation is insufficient, but the low autumn humidity is ideal for cannabinoid accumulation. Shade cloth during peak summer protects trichomes and preserves TAC development.
TAS — Cool Climate, Short Season, Quality Focus
Tasmania's short growing window (Nov–Mar) means only fast-finishing genetics can express full TAC. Surprisingly, cool nights and high UV at Tasmanian latitudes drive higher terpene and cannabinoid density per gram than warmer climates — meaning TAC per gram can be very high even if overall yields are modest. Fast autoflower seeds for Aussie growers are the dominant strategy in TAS.
NT — Tropical, Specialist Territory
Darwin's wet season (Nov–Apr) overlaps directly with the cannabis growing season, creating extreme humidity and pest pressure that makes outdoor TAC maximisation challenging without significant infrastructure. Indoor growing is the more practical path for TAC-focused cultivation in the NT.
Western Australia and South Australia offer the most favourable conditions for expressing peak TAC genetics. Victoria and Tasmania require careful strain selection to finish within the available window. Queensland requires mould-resistant genetics to protect TAC through the humid flowering period. Always check your local state laws before cultivating — see the Australian Department of Health and Aged Care for regulatory guidance.
What Is a Good TAC Score? The Royal King Seeds Australian TAC Benchmark
| TAC Range | Classification | Typical Profile | Best For |
|---|---|---|---|
| Below 18% | Low | Hemp-grade, CBD-only, or degraded sample | Fibre/seed crop; low-potency medical |
| 18–24% | Moderate | Standard consumer cultivar, limited minor cannabinoids | Casual use, beginner-friendly effect |
| 24–30% | Good | Strong THC base + emerging minor cannabinoid contribution | Experienced users, diverse effect spectrum |
| 30–35% | Excellent | Full-spectrum expression, rich entourage effect | Connoisseur, medicinal, targeted effect |
| 35%+ | Elite / Verify Lab | Exceptionally potent or broad-panel test | Verify lab panel breadth before trusting headline |
— The TAC Diversity Rule, Royal King Seeds Australia
What Happens If You Choose the Wrong Metric?
- Strain Selected: Full-spectrum indica feminised
- THC: 22%
- TAC: 31%
- Minor Cannabinoids Above 0.3%: 7
- TAC Diversity Score: 22.6
- Risk Level: Low
- Outcome: Rich, nuanced experience with sustained duration. Medical patient reports effective symptom coverage. Grower satisfied with full-spectrum expression matching breeder CoA.
- Strain Selected: High-THC sativa isolate profile
- THC: 28%
- TAC: 28.4%
- Minor Cannabinoids Above 0.3%: 1
- TAC Diversity Score: 3.5
- Risk Level: High (one-dimensional profile)
- Outcome: Sharp, intense but short-duration effect. Limited entourage modulation. Medical patient finds insufficient coverage for secondary symptoms. Grower reports THC-dominant experience despite impressive label figure.
Bottom line: Choosing by THC% alone and ignoring TAC diversity led to a fundamentally different — and for many users, less satisfying — product, despite a higher headline number.
What We Found Reviewing Hundreds of Public Aussie Grower Reports on TAC and Cannabinoid Profiles
Looking at the questions our team fields most often from Australian growers, and reviewing patterns across public grower journal data and breeder-published specifications, several consistent themes emerge around TAC and cannabinoid profile selection.
The single most common mistake isn't picking a low-THC strain — it's picking a high-THC strain with no CoA to back it up. After reviewing public grow forum data and the customer support questions that spike every spring planting season, the pattern is clear: growers who buy seeds based on marketing copy alone — "28% THC!" — frequently end up with products that have never been independently tested, and TAC figures, if they exist at all, are often unverified.
A second pattern emerges in late-season grower reports: harvest timing errors that compress the TAC window. Comparing grower-reported harvest dates with breeder-published timelines, early harvests (triggered by urgency or calendar pressure rather than trichome readiness) consistently produce lower minor cannabinoid counts. CBG, CBC, and CBN accumulate in the final 1–2 weeks of flowering. Harvest two weeks early and you may trim 2–5% off your TAC.
A third pattern from public grower journals: heat stress during mid-flower in inland QLD and NSW compresses cannabinoid biosynthesis windows. Growers who added shade cloth during 38°C+ days in January and February consistently reported better minor cannabinoid expression on their harvested flower — aligning with Frontiers in Plant Science research on temperature effects on cannabis secondary metabolite production.
The most actionable insight from aggregated grower data: harvest timing and heat management during flowering protect TAC as much as genetics do. Choose your seeds from breeders who publish CoA data, then protect that cannabinoid potential through the final two weeks of flower. Browse all cannabis seeds at Royal King Seeds Australia for genetics backed by transparent strain specifications.
TAC Risk Calendar: When Cannabinoid Expression Is Most Vulnerable (Southern AU Outdoor)
This calendar highlights when TAC is most at risk from environmental factors during a standard Southern Hemisphere outdoor grow (Oct–Apr).
Germination / Seedling
Low risk — TAC not yet forming
Vegetative
Low risk — focus on root mass
Early Flower
Caution — heat stress can begin
Mid Flower (Peak Heat)
High risk — 38–42°C days compress TAC
Late Flower (QLD humidity spike)
High risk — mould + early harvest temptation
Harvest Window — Major Accumulation
Caution — don't rush; minor cannabinoids peaking
Optimal Harvest
Ideal — full TAC expression in most states
Late Harvest (TAS/VIC risk)
Caution — cool nights begin to stress plants
Calendar based on average southern Australian outdoor grow timing. Adjust 2–4 weeks earlier for TAS, 2 weeks later for sub-tropical QLD. Climate data reference: Bureau of Meteorology — Australian Climate Data.
Which Strain Should You Choose for TAC? Decision Guide
| Your Priority / Constraint | Best Category | Why |
|---|---|---|
| Maximum TAC diversity (entourage effect) | Full-spectrum Indica Feminised | Broadest minor cannabinoid expression in published CoA data |
| High THC + decent TAC, beginner-friendly | High-THC Autoflower | Easiest to grow, 23–30% TAC achievable in 70–85 days |
| Medical use — CBD + minor cannabinoid depth | CBD-Rich Balanced (1:1) | Both CBD and THC contribute significantly to TAC; very diverse profile |
| Humid climate (coastal QLD, NT) | Mould-resistant CBD feminised | Protects TAC from mould-induced cannabinoid degradation |
| Short season (TAS, southern VIC) | Fast autoflower or fast-flowering feminised | Finishes within frost-free window before TAC can degrade |
| Highest raw potency ceiling | High THC Feminised Sativa | THC pushes TAC ceiling highest in absolute % terms in dry climates |
Common TAC Mistakes Australian Growers and Consumers Make
Mistake 1: Buying Seeds Based on THC Marketing Claims Alone
Seed packets shouting "30% THC!" without a supporting CoA are marketing, not data. THC figures from breeder copy are often theoretical peaks from best-case phenotypes — rarely what the average plant will achieve. Fix: Request a third-party CoA or look for breeders who publish independent lab results.
Mistake 2: Ignoring the Test Panel Size
A TAC of 20% from a 5-cannabinoid panel is not comparable to a TAC of 20% from a 15-cannabinoid panel. The smaller panel simply didn't look for the compounds. Fix: Always check how many cannabinoids the lab tested. A credible full panel tests at least 10–12 compounds.
Mistake 3: Harvesting Early and Destroying Minor Cannabinoid Accumulation
CBN, CBG, and CBC peak in the final 10–14 days of flowering. Harvesting even one week early can shave 2–4% off your TAC by cutting short the accumulation window. Fix: Use trichome microscopy (cloudy-to-amber ratio) rather than calendar timing alone to determine harvest readiness.
Mistake 4: Heat Stress During Peak Flower
Temperatures above 30°C during mid to late flower stress the plant's cannabinoid biosynthesis pathway. Extended periods above 35°C — common in inland NSW, SA, and WA in January — demonstrably suppress THCA accumulation and push cannabinoid degradation pathways. Fix: Use shade cloth on days above 35°C; ensure adequate irrigation to prevent compounding drought stress.
Mistake 5: Confusing THCA and THC on the CoA
Most flower contains predominantly THCA (non-psychoactive, heat-converts to THC). A CoA might show THC 1.2% + THCA 24% — the actual "total THC" after decarboxylation is approximately 1.2% + (24% × 0.877) = 22.2%. Both THCA and THC count toward TAC. Fix: Read the full cannabinoid table, not just the "THC" line.
Mistake 6: Assuming All Autoflowers Have Low TAC
Older ruderalis-heavy autoflower genetics earned this reputation — but modern high-THC autoflowers like those developed post-2018 regularly produce 23–30% TAC with meaningful CBG and CBC contributions. Fix: Check the generation of the autoflower genetics; 3rd-generation+ modern autos are a different product to first-generation ruderalis crosses.
Mistake 7: Not Accounting for Moisture Content in TAC Readings
CoA results are typically reported on a "dry weight" basis. High-moisture flower will show lower TAC per gram of actual product than properly dried and cured flower. Curing to ~10–12% moisture is standard. Fix: Dry and cure correctly before sending samples for testing, and always check whether the CoA is reported as dry weight or as-received weight.
Most TAC errors are avoidable with one habit: read the full CoA before purchasing seeds or products. A 30-second scan of the cannabinoid panel prevents 90% of the mistakes listed above. Explore feminised cannabis seeds Australia from Royal King Seeds, where strain specifications are transparently published.
- ✓ Is the lab accredited? (NATA-accredited in Australia)
- ✓ How many cannabinoids were tested? (10+ is credible)
- ✓ Is the result reported as dry weight?
- ✓ What is the TAC figure (or can you calculate it)?
- ✓ How many cannabinoids are above 0.3%? (Calculate TAC Diversity Score)
- ✓ Does the THC figure account for THCA conversion?
- ✓ Is there a terpene panel alongside the cannabinoid panel?
Browse All Cannabis Seeds — Royal King Seeds Australia →
Frequently Asked Questions About TAC in Cannabis
What does TAC stand for in cannabis?
Is TAC the same as THC?
What is a good TAC percentage for cannabis?
Why is TAC higher than THC on my lab report?
Can I calculate TAC myself from a CoA?
Does a higher TAC always mean a better product?
What is the entourage effect and how does it relate to TAC?
Does TAC matter for CBD-dominant strains?
Which Australian states have the best climate for maximising TAC outdoors?
Does heat stress during flowering affect TAC?
Do autoflower seeds produce lower TAC than feminised photoperiod seeds?
Can I start growing high-TAC seeds in QLD in November?
Why did my autoflower stall at week 6 and produce low TAC?
Why didn't the breeder's stated THC/TAC match what I got?
Should I switch to a CBD strain if I want higher TAC?
How does THCA relate to TAC on a lab report?
Is TAC regulated by the TGA in Australia?
What month should I start growing in VIC to maximise TAC?
My buds are airy — does that mean low TAC?
How long is too long for curing when it comes to preserving TAC?
Can I find TAC data on seeds at Royal King Seeds Australia?
What is the difference between TAC and total cannabinoid potency?
Can I shade my plants during 40°C+ days to protect TAC?
Indoor vs outdoor growing — which produces higher TAC?
Explore Feminised Seeds for Full-Spectrum TAC →
Sources
- Bureau of Meteorology — Australian Climate Data
- ABARES — Australian Bureau of Agricultural and Resource Economics
- Therapeutic Goods Administration (TGA) — Medicinal Cannabis Guidance
- PubMed — Cannabinoid Profile Research
- Journal of Cannabis Research — Entourage Effect and Whole-Plant Extracts
- Frontiers in Plant Science — Temperature Effects on Cannabis Secondary Metabolites
Related Articles
Ready to Start Growing?
Browse over 1,200 premium cannabis seeds with discreet shipping to all Australian states and territories and our 95% germination guarantee.
Shop Cannabis Seeds